During the Spring 2020 semester, a survey of students' perception of the General Education program was conducted as a step in answering the question, "How well are the General Education Goals serving the program mission statement". The results of that indirect assessment are found here. The following direct assessment report was completed in February 2020 with data from Fall 2008 through Fall 2019. It reflects the ATU general education goals at that time.
Introduction
The Course, Program, and General Education (CPGE) Assessment Program was created in 2008 to capture direct evidence of student learning for each of the general education outcomes. Each course approved to collect general education data has established questions that are mapped to the corresponding general education goals. These questions have a scale chosen by the department that roughly equates to pass/fail and data is captured through the Banner system. This data can be sorted in a variety of ways to provide information for the improvement of general education courses, goals, and student achievement.
The general education curriculum is designed to provide a foundation for knowledge common to educated people and to develop the capacity for an individual to expand that knowledge over his or her lifetime. Students who have completed the general education curriculum at Arkansas Tech University will be able to:
Data on general education outcomes has been collected since fall semester 2008 with first adopters of the CPGE data collection in Biology, Chemistry, Geology, and Physical Science programs. Since then, twenty programs in ten departments and three colleges have added their general education assessment data. The data set for this report includes fall semester 2008 to fall semester 2019.
Results Summary
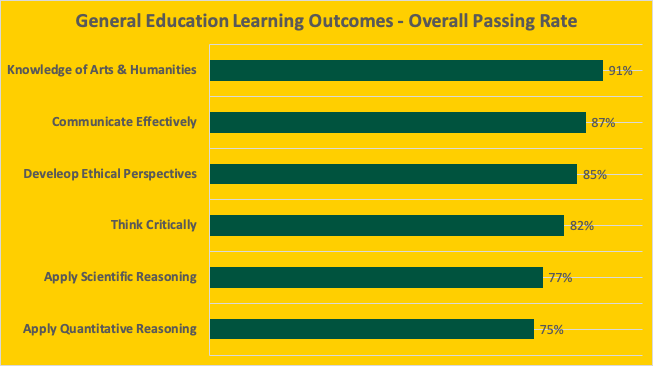
The following table shows the learning outcomes passing rates of all students assessed.
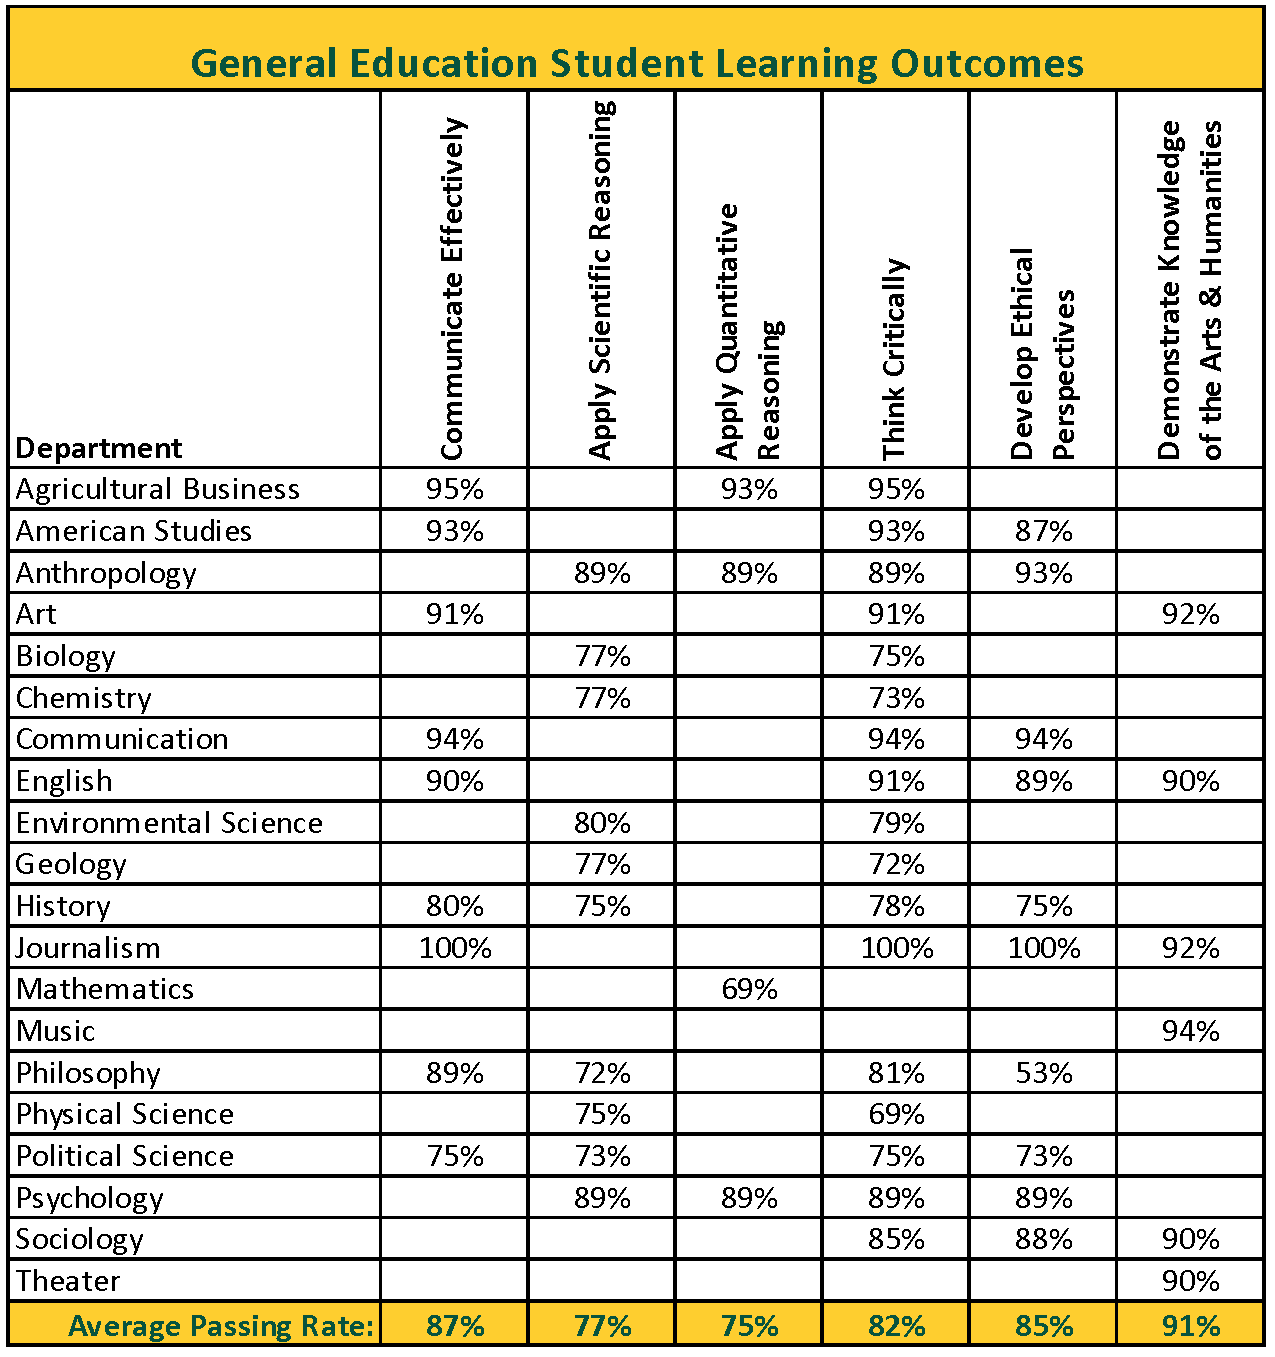
Programs measured up to four outcomes over the time of this study. The chart below shows passing rates of all general education learning outcomes alphabetically by department.
Results by Learning Outcome, Department, Program, and College
Learn more about how these outcomes were collected and analysed:
return to general education home page